Fixed-Site Monitoring Stations and Data in Narragansett Bay
Map and Site Locations, Monthly Graphs, Real Time, and Network Data
Background:
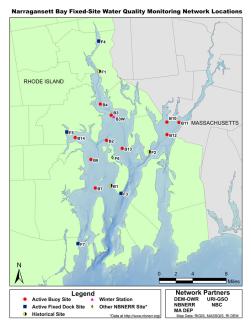
To assess water quality in Narragansett Bay, a number of agencies worked together to establish a network of fixed-site monitoring stations. The network is now an essential component of Rhode Island's monitoring strategy for the Bay. The stations were located strategically to transect the length of Narragansett Bay and serve as sentinels of changing conditions. There is a greater concentration of sites in upper Narragansett Bay purposefully located due to the presence of discharges from both wastewater treatment facilities and large tributary rivers. The DEM Office of Water Resources has taken a lead role in coordinating the multi-agency network effort. The cooperating agencies (as of 2020) are as follows:
- Rhode Island Department of Environmental Management- Office of Water Resources (RIDEM-OWR),
- University of Rhode Island, Graduate School of Oceanography (URI-GSO),
- Narragansett Bay Commission (NBC),
- Narragansett Bay National Estuarine Research Reserve (NBNERR),
- Massachusetts Department of Environmental Protection (MassDEP),
- Narragansett Bay Estuary Program (NBNEP), and URI Coastal Institute.
- Southern New England Estuary Program (SNEP)
- Northeast Regional Association Coastal Ocean Observing Systems (NERACOOS)
In 2004, a total of nine stations were operated. During 2005, the fixed-site network was expanded by three stations. In 2008, B14 was added and B3W. In 2017, MassDEP joined the NBFSMN by adding two more stations to the network (B10 and B11). Currently, there are 15 active stations. During 2019, through a SNEP funded project, 4 stations were upgraded to improve real-time data capabilities (B3, B2, B6, and B13). Real-time data visualizations for 8 of the 15 stations are provided through a data sharing agreement with NERACOOS.
Monitoring stations in the network are fitted with instruments that collect water quality data on a continuous basis (usually every fifteen minutes). Off-shore stations are on buoys, and near-shore stations are attached to structures, such as docks that are accessible from land. Some stations operate year-round, but most are seasonal (spring to fall), with their instruments removed and stored for the winter. Each station measures water properties at particular depths, usually from the bottom and surface of the Bay. Data are then transmitted to on-shore computers where scientists analyze and interpret them.
In addition to location and depth, these data normally include:
-
Temperature
- Warmer waters are more vulnerable to water quality problems because they hold less dissolved oxygen, stratify more readily, and encourage phytoplankton (microscopic algae) growth. Hence, as the summer progresses and the Bay becomes warmer, it is more vulnerable to water quality problems. Shallower parts of the Bay also warm more quickly, and these areas often have lower dissolved oxygen and higher chlorophyll in the summer.
-
Salinity
- The concentration of salts in estuarine water reflects the volume of freshwater that is mixing with the saltwater that moves into the Bay from the ocean. The flows of freshwater from surface runoff, rivers, and wastewater discharges can carry pollutants into the Bay. Stations near the rivers that flow into the Upper Bay tend to report both lower salinity and more problems than those in the Lower Bay.
-
Chlorophyll
- Chlorophyll is a measurement that reflects the concentration of phytoplankton (microscopic algae) in the water. Phytoplankton blooms are related to low dissolved oxygen; elevated chlorophyll can be a signal of declining water quality.
-
Dissolved Oxygen
- Dissolved oxygen (DO) is necessary for life and among the most ready and reliable indicators of water quality. Hence, if DO levels drop too low, too long, sea life will be stressed, flee, or die. ("Hypoxia" means low oxygen; "Anoxia" means no oxygen.)
-
pH
- proper pH levels are required for organisms to develop healthy skeletal structures. Low pH can stress ses life in all life stages.
During the summer months, DEM, with assistance from URI-GSO, uses the data from selected critical stations to track water quality conditions in portions of the Bay known to be vulnerable to hypoxia. DEM also uses the data from all stations in periodic assessments of overall Bay water quality required by the federal Clean Water Act.
In trying to understand the ecological health of the Bay, scientists review data from the monitoring stations along with other important information such as rainfall, tides and flow patterns, wind conditions, and documented loading rates for pollutants. All of these factors influence the Bay ecosystem in complex ways. Predicting when and where water quality will "crash" and cause catastrophic events, such as fish kills, is challenging because the Bay ecosystem is so dynamic. Researchers find the four variables that the stations measure - temperature, salinity chlorophyll, and dissolved oxygen -- critical to the process.
Data from the entire network was compiled and jointly processed for the first time in 2004. Annual network data sets are available and downloadable through this website. Graphs of these data are downloadable in a monthly format through this website. A table of station characteristics follows the map. Site locations may change slightly over the years. A table with GPS coordinates leased on annual averages can be requested by contacting stoffel@uri.ed
CHARACTERISTICS OF FIXED-SITE MONITORING STATIONS
AND RECENT DATA ON WATER QUALITY IN NARRAGANSETT BAY
Label |
Location |
Maintaining Agency |
Status |
Data Links |
General Water Quality Conditions |
|---|---|---|---|---|---|
B2 |
North of Prudence Island (representative of Upper Bay) (NP) |
URI GSO DEM OWR |
Deployed Seasonal |
Graphs Data Narrbay |
Upper Bay area vulnerable to periodic hypoxia in bottom waters |
| B3 | South of Conimicut Point (station just south of lighthouse) (CP) |
URI GSO DEM OWR |
Deployed Seasonal |
Graphs Data Narrbay |
Polluted with nutrients and pathogens. Upper Bay area is vulnerable to periodic hypoxia in bottom waters. Important area to assess changes due to WWTF upgrades. |
| B3W | Upper Bay Winter Station (station on channel Marker 13 just south of Conimicut Pt) (UB) |
URI GSO DEM OWR |
Deployed Seasonal |
Data Narrbay |
Polluted with nutrients and pathogens. This is a surface only station. |
| B4 | Bullock's Neck or Reach/Lower Providence River (downstream of Fields Point Wastewater Treatment Facility) (BR) |
NBC | Deployed Seasonal |
Graphs Data Narrbay NBC |
Polluted with nutrients and pathogens. Influenced by CSO and WWTF discharges. Vulnerable to hypoxia and occasional anoxia. |
| B6 | Mount View (mouth of Greenwich Bay) (MV) |
URI GSO DEM OWR |
Deployed Seasonal |
Data Narrbay |
Well-flushed, occasional hypoxia. |
| B7 | Quonset Point (QP) | URI GSO DEM OWR |
Deployed Seasonal |
Data Narrbay |
Well-flushed, occasional hypoxia |
| B10 | Cole River (mouth of Cole River in Mt Hope Bay) (CR) |
MassDEP URI/GSO |
Deployed Seasonal |
Data | Polluted with nutrients and pathogens. Upper Bay area is vulnerable to periodic hypoxia in bottom waters. |
| B11 | Taunton River (Mouth of Taunton River in Mt Hope Bay) (TR) |
MassDEP URI/GSO |
Deployed Seasonal |
Data | Polluted with nutrients and pathogens. Upper Bay area is vulnerable to periodic hypoxia in bottom waters. |
| B12 | Mount Hope Bay (MH) | URI GSO DEM OWR |
Deployed Seasonal |
Data Narrbay |
Vulnerable to hypoxia. Well-flushed, occasional hypoxia. |
| B13 | Poppasquash Point (Upper East Passage) (PP) |
URI GSO DEM OWR |
Deployed Seasonal |
Data Narrbay |
Well-flushed, occasional hypoxia. |
| B14 | Sally Rock (Mid-Greenwich Bay) (SR) |
URI GSO DEM OWR |
Deployed Seasonal |
Data Narrbay |
Polluted with nutrients and pathogens. Vulnerable to hypoxia and occasional anoxia. |
| F3 | T-Wharf (South of Prudence Island on East Passage) (TW) |
NBNERR | Deployed Year-round |
Data NBNERR Narrbay |
Good water quality. Well-flushed. |
| F4 | Phillipsdale (in Seekonk River-downstream of Bucklin WWTF) (PD) |
NBC | Deployed (Year-round) |
Data Narrbay NBC |
Polluted with nutrients and pathogens. Heavily influenced by combined sewage overflow (CSO) and WWTF discharges. Regularly anoxic during the summer in bottom waters. |
| F5 | Greenwich Bay (western edge in a marina near the mouth of Appanoug Cove) (GB) |
URI GSO DEM OWR |
Deployed Seasonal |
Graphs Narrbay Data |
Polluted with nutrients and pathogens. Bay area is vulnerable to hypoxia and occasional anoxia throughout the water column. |
| F7 | URI GSO Dock (GD) | URI GSO | Deployed Year-round |
Data Narrbay |
Very good water quality. Well-flushed. Surface only. |
Label
A letter and number that refers individual monitoring stations, as marked on the map above. (Note, however, that these locations are only approximate and may change.) The letter indicates whether the station is attached to a buoy (B) or fixed (F) to a structure near shore, such as a dock. All stations monitored near-surface and bottom conditions unless otherwise specified.
Location - The name that people ordinarily use for the vicinity of the station.
Maintaining Agency
The name of the agency that maintains the monitoring station:
- NBC - Narragansett Bay Commission
- RIDEM - Rhode Island Department of Environmental Management
- OWR - Office of Water Resources
- F&W - Division of Fish & Wildlife
- URI GSO - University of Rhode Island Graduate School of Oceanography
- NBNERR - Narragansett Bay National Estuarine Research Reserve
- MassDEP - Massachusetts Department of Environmental Protection
Status
Since the capacity of the state to monitor water quality is growing and changing, status indicates a station is operational and when:
- Deployed - In the water and operational
- Seasonal - Generally sampled from May through October
- Year-round - Weather permitting, sampled year round
- Inactive- Site no longer in service
Stations provide water-quality data either year-round or only in the summer months, when conditions are most dynamic.
Data Links
Most stations take two measurements (near the surface and the bottom) every 15 minutes.
- Raw Data: This data is accessed (via wireless transmission), consolidated, and raw data is posted on-line through real-time links (link to real-time).
- Monthly summary graphs: are compiled and posted on this website in a pdf format.
- Yearly files: are downloadable through the network data link.
- Discontinued Station: present or previous partner’s data that was generated before the network was established (prior to 2005) or not included in the network.
- F6: Potter’s Cove available through www.nbnerr.org
- F2: RWU Roger William University (2006) contact: Scott Rutherford at srutherford@rwu.edu
- F1 and B1: URI/GSO stations (Pomham Rocks and South Prudence) (2001-2002). Contact Heather Stoffel at stoffel@uri.edu
General Water Quality Conditions
This column characterizes trends in water quality for each site. Stations are positioned to represent the diversity of conditions in the Bay, ranging from areas that are normally free of water quality problems (e.g., because they are far from sources of pollution and/or are well-flushed areas) to challenged (e.g., because they are shallow, poorly flushed, and/or subject to pollutant loadings, such as nutrients).
In general, water quality conditions in the Bay from the north, where the tributaries and wastewater treatment facilities empty into the Bay, to the south, where the Bay opens into Rhode Island Sound. In general, during summer months stations in better waters will report lower readings for temperature and chlorophyll and higher for dissolved oxygen. Such waters are less likely to suffer algae bloom problems and fish kills. For specific water quality conditions, between Memorial Day and Columbus Day each year, please refer to the water quality report.
NBFSMN Publications and Reports
(A list of references and links to reports that have been published using NBFSMN data)
-
Baskind Abigail, Ahumada G, Gomes K, Stoffel H, Gu S, Davies AJ and Wang H (2025) Unraveling natural carbonate variability in Narragansett Bay, RI using multiple high temporal resolution pH time series. Front. Mar. Sci. 12:1552350.doi: 10.3389/fmars.2025.1552350
- Bergondo, Deanna, Kester, D.R., Stoffel, H.E., Woods, W.L., 2005. Time series observations during the low sub-surface oxygen events in Narragansett Bay during summer 2001, Marine Chemistry, 97: 90-103.
-
Boothman, Warren, Coiro, L., 2024.Modern history of hypoxia in Narragansett Bay: The geochemical record, Science of The Total Environment, Volume 953, 2024, 176007, ISSN 0048-9697, https://doi.org/10.1016/j.scitotenv.2024.176007. (https://www.sciencedirect.com/science/article/pii/S0048969724061631)
-
Codiga, Daniel. L., Stoffel, H. E., Oviatt, C. A., Schmidt, C. E., Island, R., Bay, N., et al. (2022). Managed Nitrogen Load Decrease Reduces Chlorophyll and Hypoxia in Warming Temperate Urban Estuary, 1–22. Frontiers in Marine Science, Vol 9.
-
Codiga, D.L. 2020. Further Analysis and Synthesis of Narragansett Bay (RI/MA USA) Oxygen, Chlorophyll, and Temperature. NBEP Technical Report. NBEP-20-231A. URL: https://figshare.com/s/7d51f2540df6638a4552. DOI: 10.6084/m9.figshare.12547676.
-
Codiga, D.L., 2016. NBEP State of the Watershed Indices from Oxygen & Chlorophyll Time Series Final Project Report: 6/4/2016.
-
Codiga, D.L., H.E. Stoffel, C.F. Deacutis, S. Kiernan, and C.A. Oviatt, 2009. Narragansett Bay hypoxic event characteristics based on fixed-site monitoring network time series: Intermittency, geographic distribution, spatial synchronicity, and inter-annual variability. Estuaries and Coasts 32:621‐641., DOI 10.1007/s12237-009-9165-9.
-
Codiga, D.L., 2008. A Moving Window Trigger Algorithm to Identify and Characterize Hypoxic Events Using Time Series Observations, with Application to Narragansett Bay. Technical Report 2008-01. Graduate School of Oceanography, University of Rhode Island, Narragansett, RI. 101pp.
-
Coupland, Catherine M., 2015. Estimating daily primary production and nighttime respiration in estuaries by an in-situ carbon method. M.A. Thesis in Oceanography, University of Rhode Island:Kingston, RI. 633pp.
- Estuary Program, Narragansett Bay; Codiga, Dan (2021). Analysis and Synthesis of Eutrophication-Related Conditions in Narragansett Bay (RI/MA USA): Updated Through 2019. figshare. Book. https://doi.org/10.6084/m9.figshare.14830890.v1
-
Estuary Program, Narragansett Bay, 2017. State of Narragansett Bay and Its Watershed 2017 Technical Report
- Galligan, Bryan, Stuart, Y, McManus M.C., Stoffel, H 2022. Hypoxia-induced predation refuge for northern quahogs (Mercenaria mercenaria) in a temperate estuary. Estuarine, Coastal and Shelf Science, Volume 265, 2022,107732, ISSN 0272-7714, https://doi.org/10.1016/j.ecss.2021.107732. (https://www.sciencedirect.com/science/article/pii/S0272771421005801)
-
NBFSMN Final Grant Report: 2005-2008.
- NBNERR, 2019-2023. Annual reports:http://nbnerr.org/additional-resources/
-
-
Oviatt, Candace, Heather Stoffel, Kristin Huizenga, Laura Reed, Daniel Codiga, Lindsey Fields. 2021. A tale of two blooms in a northeast estuary USA: how storms impact nutrients, multiple tropic levels and hypoxia. Hydrobiologia. DOI : 10.1007/s10750-021-04768-7
-
Oviatt, C., Smith, L., Krumholz, J., Coupland, C., Stoffel, H., Keller, A., McManus, M.C., and Reed, L., Managed nutrient reduction impacts on nutrient concentrations, water clarity, primary production, and hypoxia in a north temperate estuary Estuarine, Coastal and Shelf Science, Volume 199, 5 December 2017, Pages 25-34 https://www.sciencedirect.com/science/article/pii/S0272771417309319
-
Oczkowski, Autumn, Hunt, C.W., Miller, K. Comparing Measures of Estuarine Ecosystem Production in a Temperate New England Estuary. Estuaries and Coasts 39, 1827–1844 (2016) doi:10.1007/s12237-016-0113-1
- Schmidt. Courtney E., Robinson, R.S., Fields, L., Nixon, S.W., 2016. Changes to nitrate isotopic composition of wastewater treatment effluent and rivers after upgrades to tertiary treatment in Narragansett Bay watershed, RI. Marine Pollution Bulletin 104(2016)61-69. http://dx.doi.org/10.1016/j.marpolbul.2016.02.010
-
Smith, Leslie M. 2011. Impacts of spatial and temporal variation of water column production and respiration on hypoxia in Narragansett Bay. Thesis for Ph.D., University of Rhode Island.
-
Stoffel, Heather and Joseph Langan. 2020. pH Trends in Narragansett Bay using Narragansett Bay Fixed-Site Monitoring Network Data. Final Report prepared for State of Rhode Island Department of Environmental Management
Office of Water Resources and University of Rhode Island Coastal Institute. http://www.dem.ri.gov/programs/emergencyresponse/bart/stations.php - Wang H, Codiga D, Stoffel H, Oviatt C, Huizenga K and Grear J (2024) Effect of nutrient reductions on dissolved oxygen and pH: a case study of Narragansett bay. Front. Mar. Sci. 11:1374873. doi: 10.3389/fmars.2024.1374873